Real-time metrics
PgDog EE collects and sends its own metrics to the Dashboard. This provides a real-time view into PgDog internals, without a delay that's typically present in other monitoring solutions.
How it works
Real-time metrics are available in both Open Source and Enterprise versions of PgDog. The open source metrics are accessible via an OpenMetrics endpoint or via the admin database.
In PgDog EE, the same metrics are collected and sent via a dedicated uplink to the Dashboard. This provides an out-of-the-box experience for monitoring deployments, without delays typically introduced by other solutions.
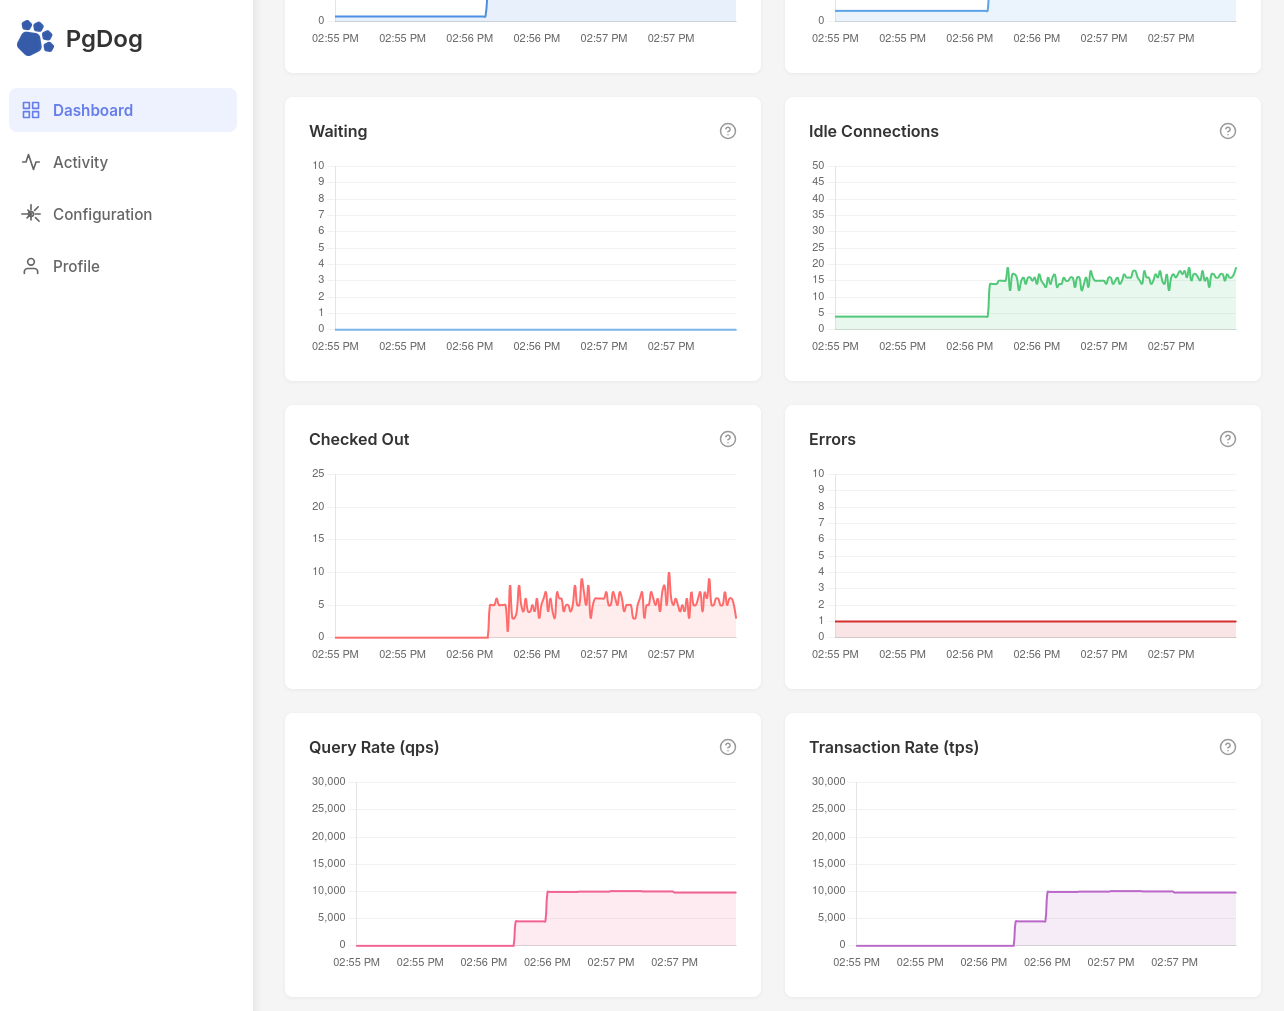 Real-time metrics.
Since metrics are just integers, they can be serialized and sent efficiently. To deliver second-precision metrics, PgDog EE requires less than 1KB/second of bandwidth and basically no CPU or additional memory.
Once the metrics reach the Dashboard, they are pushed down to the web UI via a WebSocket connection. At the same time, per-minute aggregates are computed in the background and stored in a separate Postgres database. This provides a historical view into database performance.